Market regime and volatility
The question: “Is this market unusually quiet or active, and how does that compare with its own recent history?”
The combined context panel describes observed hourly variation with two readings that share one clock:
- the volatility chart measures how large recent hourly returns were;
- the regime strip names the model state for that same hour.
Both describe past observations. Neither is a forecast, a trading signal or a calibrated confidence score.
Open it
Show the market regime and volatility context for Bitcoin over the last seven days.
The widget shows a Volatility measure control, a shared Inspect hour ending slider and a regime strip beneath the chart. The status line repeats the selection as Selected hour ending <time> and names the current state. Ask for another ticker or window the same way you ask for any other focused chart.
See the panel
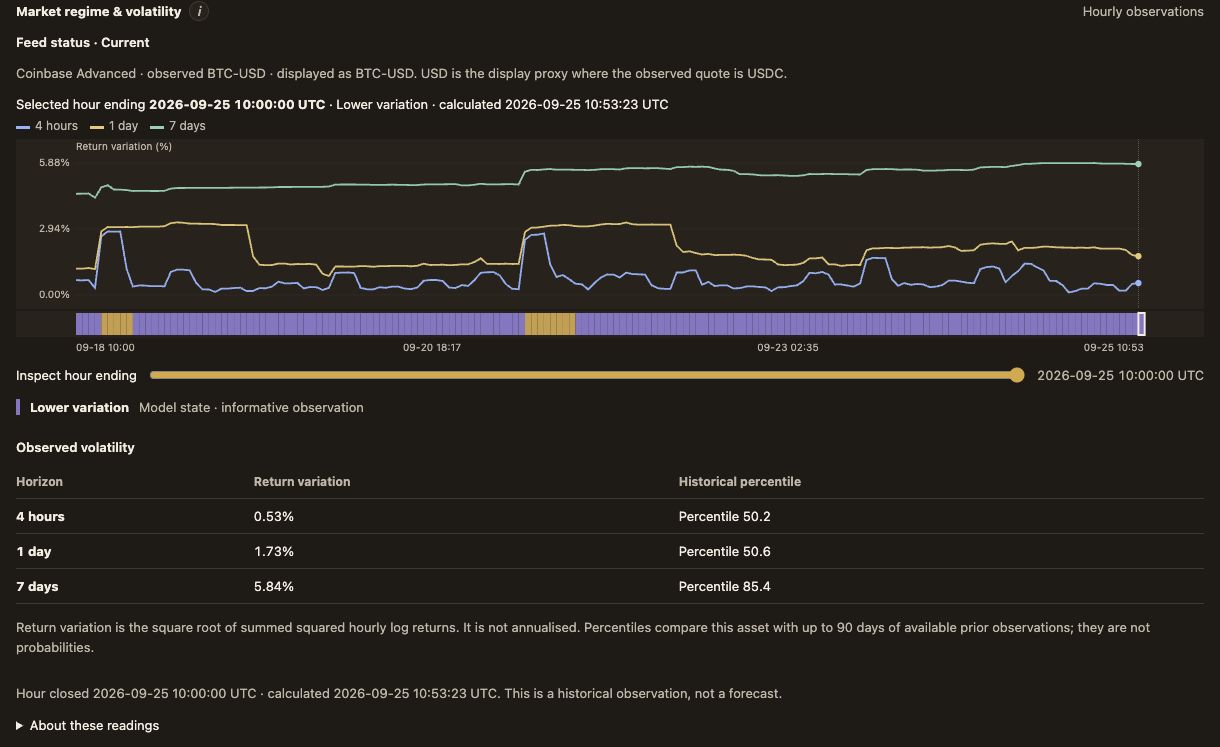
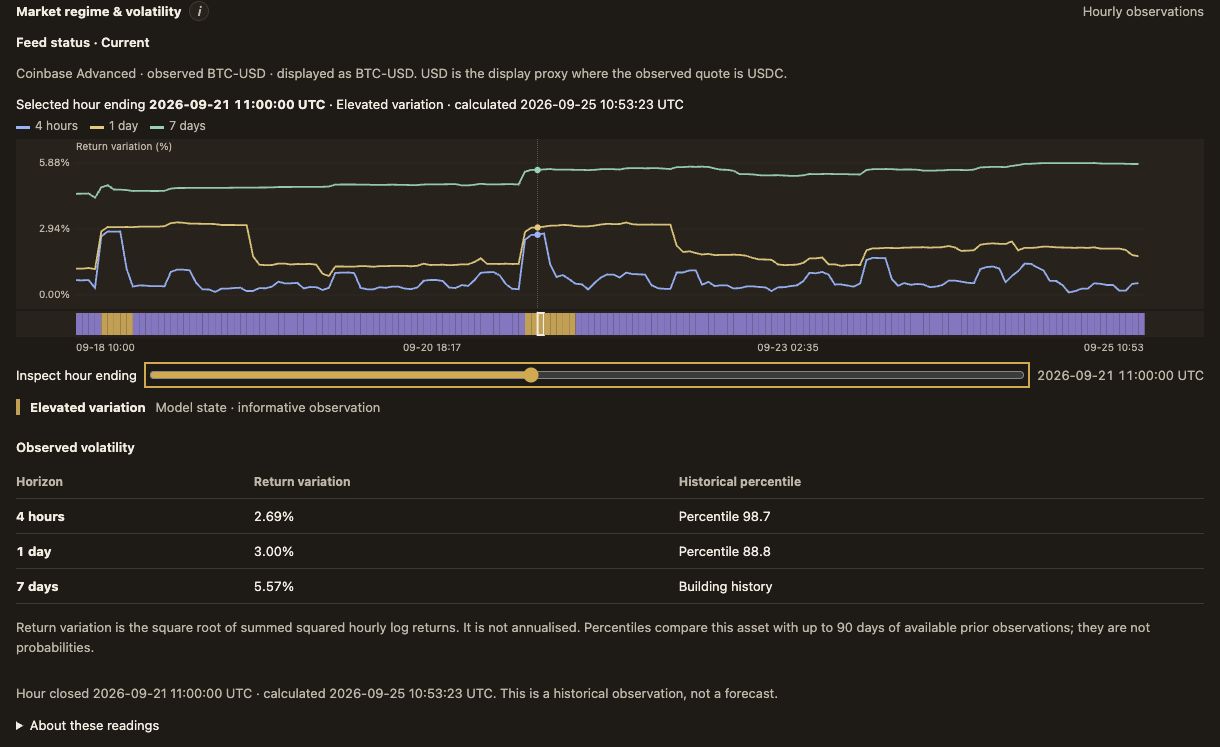
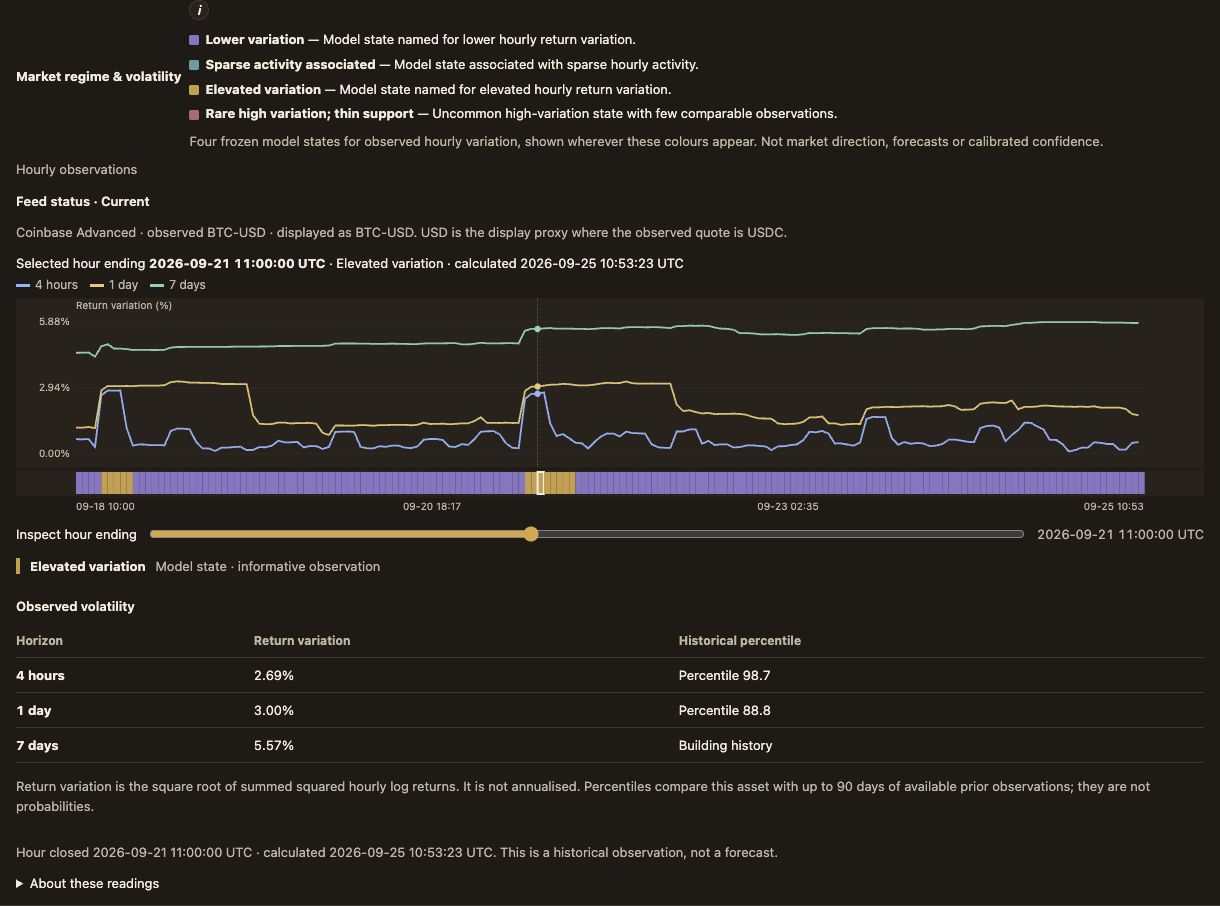
Research Desk (browser) captures, 25 September 2026. These are static examples, not MCP widget renders and not live quotes.
One hourly clock
The context panel observes hourly closes. It stays hourly when you change a price chart between 1h, 4h and 1d candles; changing the candle interval does not change these observations. The widget shows the requested window and the source pair it observed.
Inspect hour ending is a local reader, not a new request. Moving it points the chart, the regime strip and the readout at the same captured hour. Use Get a fresh read when you want a new capture; that may include source corrections and is not the original frozen result.
The two measures
| Measure | What it shows | Units |
|---|---|---|
| Observed return variation | The size of hourly return variation across the selected horizon | Percent; the square root of summed squared hourly log returns. It is not annualised |
| Historical percentile | Where the selected horizon's reading sits among this market's own earlier observations | A percentile from 0 to 100 |
Each reading is available on three horizons: 4 hours, 1 day and 7 days. These are different measurement windows over the same hourly observations — the short window reacts faster, the longer window describes a broader span. Each horizon carries its own magnitude and percentile, so one can be ready while another is still building history.
The historical comparison window
Percentiles compare only this market with up to 90 days of available prior observations. That is a cap on the available baseline, not a promise that every asset has 90 complete days of history. Missing ranks can mean insufficient history, even when a magnitude exists; a new or sparse market can show a magnitude with no percentile yet.
Regime state colours
The strip uses the same four frozen model states wherever those colours appear. The released widget maps them to purple, teal, amber and pink in this order:
| State | Colour | Released description |
|---|---|---|
| Lower variation | Purple | Model state named for lower hourly return variation |
| Sparse activity associated | Teal | Model state associated with sparse hourly activity |
| Elevated variation | Amber | Model state named for elevated hourly return variation |
| Rare high variation; thin support | Pink | Uncommon high-variation state with few comparable observations |
The supplied legend capture in See the panel shows the same order. These names describe the model's hourly variation state. They are not market direction, forecasts or calibrated confidence. An unchanged colour while volatility moves is valid: the state is an hourly classification, and the magnitudes are separate measurements that can change within one state.
Gaps, readiness and limits
- The panel shows whether the hourly feed is current or interrupted and names the observed source pair; treat an interruption as incomplete coverage, not a zero. Where the observed quote is USDC, USD is the display proxy.
- When a measure has no finite readings in the selection, the chart states: “No finite readings for this measure; regime observations remain.” The regime observations are still shown.
- Missing observations remain gaps, never zero. A percentile that is still building history, or a horizon whose rank is not yet available, is an expected limit — not an error and not a zero.
- Historical observations are not necessarily current. Keep the read time and the selected hour when you discuss a reading.
Where to go next
- How the readings work for units, clocks and coverage.
- Market readings for how this panel sits beside the other metrics.
- Tool reference for the exact
research_market_contextinput and result contract.