Markets, Tickers and Taxonomy
These sections answer different starting questions. You do not need to browse all three before opening a chart.
Markets: what is on the board?
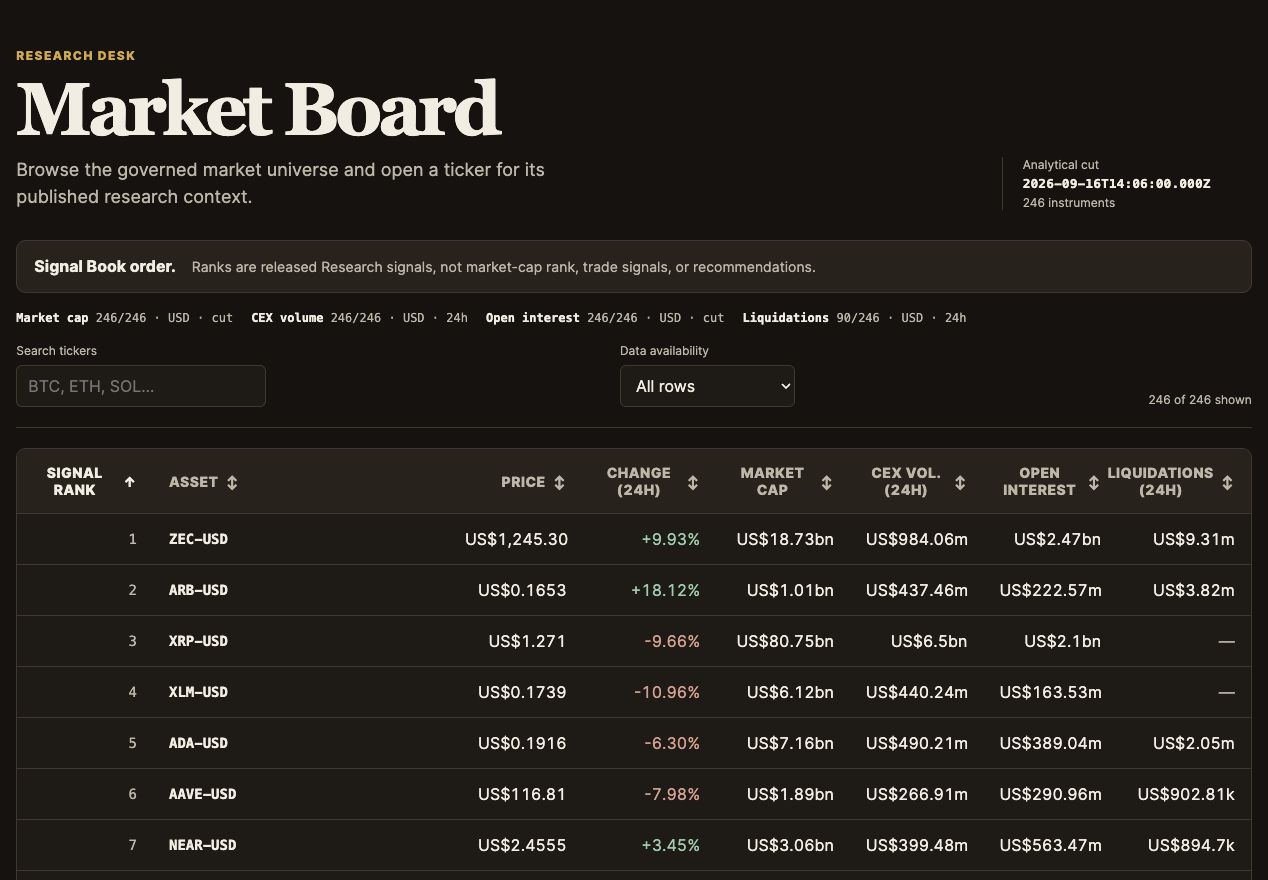
Markets shows the tracked universe and its available market readings. Search for an asset, compare columns or change the sort order, then open a ticker for its history.
The default Signal Rank is the published Signal Book attention order. It is a way into the research, not a promised return or a recommendation to buy the first asset.
Tickers: where is the asset I want?
Tickers is the searchable directory. Use a name or symbol, refine by category and select an asset to enter its chart workspace.
This is the simplest route when you already know which asset you want. BTC-USD, for example, identifies Bitcoin quoted in US dollars; always check the source and units on the chart itself.
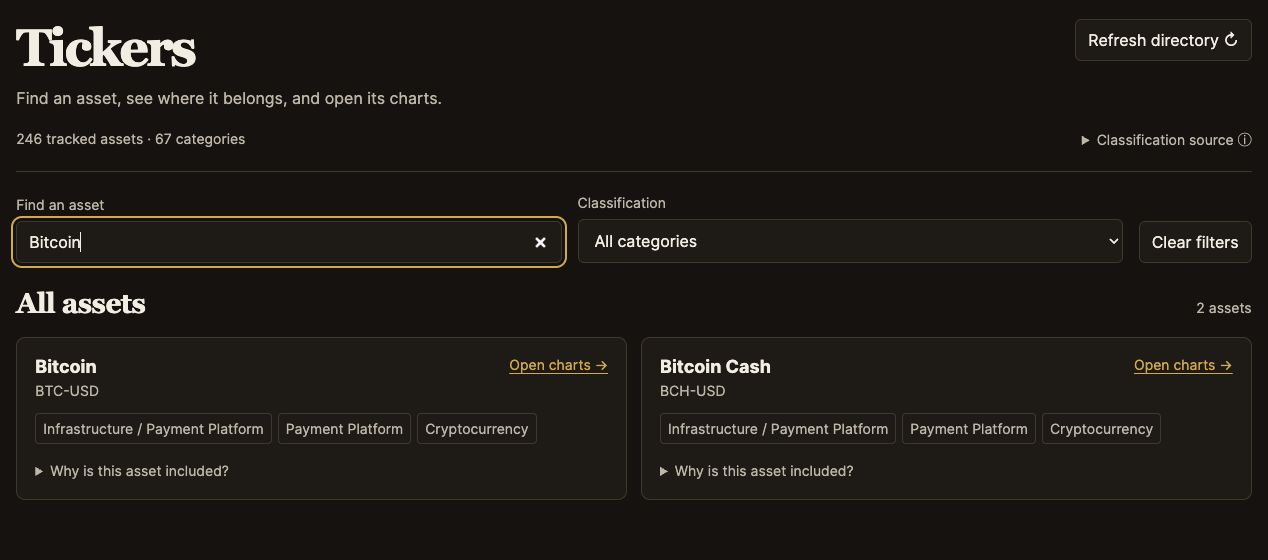
Both screenshots were captured on 16 September 2026. Results and readings change over time.
Taxonomy: which assets belong to a theme?
Taxonomy is the classification browser: sectors, subsectors, technology and token categories. Inspect the member count and use Why included? for the recorded classification behind an asset's membership.
One asset can appear in more than one category. A category is a recorded grouping, not an endorsement or a claim that its members will behave alike.
Open a category in Cohorts to use it as Group A, then choose Group B and a benchmark. Learn the cohort controls.
Pick the shortest route
- “What should I inspect on the tracked market?” → Markets.
- “Show me NEAR.” → Tickers.
- “Which assets are classified as AI-related?” → Taxonomy.
- “How did AI-related assets compare with DeFi?” → Cohorts.