Asset directory widget
The question: “Which assets are covered, and what are they classified as?”
Which assets belong to artificial intelligence?
The widget resolves canonical tickers and returns their governed category memberships. It is the chat-side view of Research's Taxonomy browse.
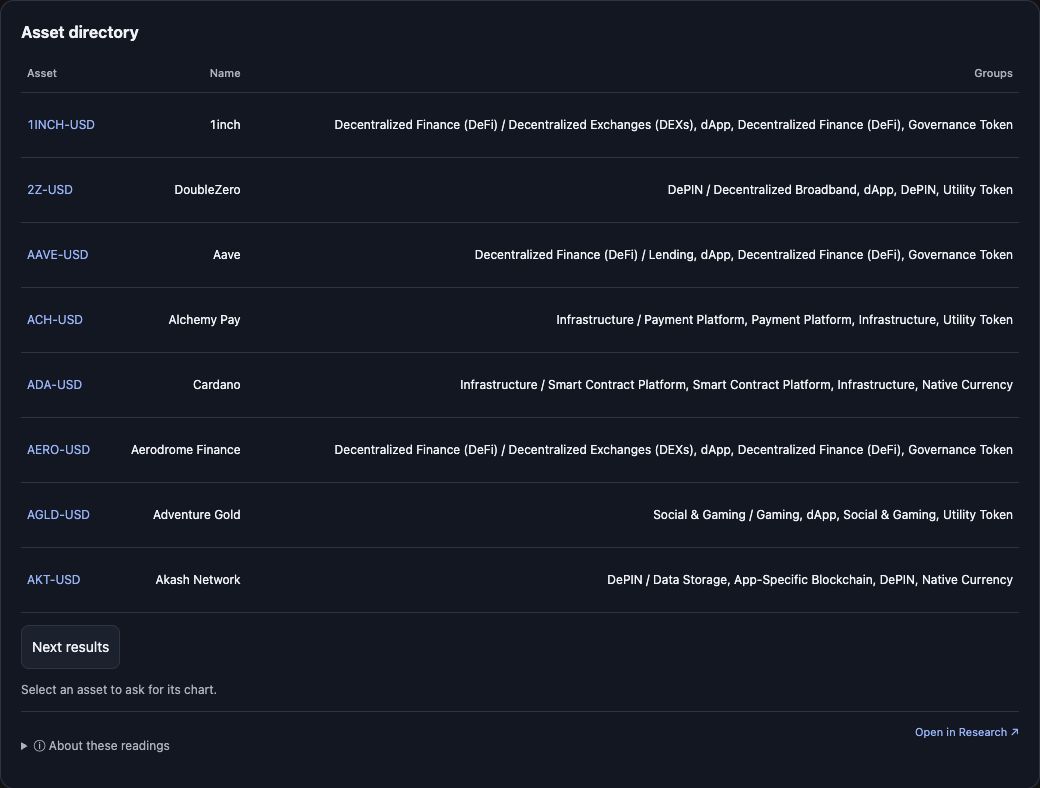
Captured 25 September 2026 with the returned directory page. Select the image to view it full size.
What it shows
| Column | Reading |
|---|---|
| Asset | Canonical ticker; select it to ask for its price chart |
| Name | Asset name as returned by the catalogue |
| Groups | Named category memberships for that asset |
Controls
- Previous / More — pages the already-loaded rows eight at a time (local paging; there may be more loaded rows than the eight on screen).
- Next results — when the result reports another page, requests the next one as a new tool read with the returned offset.
- Ticker buttons hand a price-chart request to the conversation.
- Shared controls: Expand when the host supports fullscreen, Get a fresh read, Open in Research ↗.
Units, selection and limits
- Category membership is the current governed catalogue, not a historical reconstruction.
- A ticker can belong to more than one group; the list shows the returned labels.
- For a comparison of two categories, move to the Cohorts widget; membership labels remain the same.
A useful follow-up
Compare that category with decentralised-finance assets over seven days, using Bitcoin as the benchmark.
See the directory and market board in Research.