Investigate a price move
The question: “What happened during this move, and what do the other readings add?”
Open an asset from Markets or Tickers. Its workspace combines a price chart with optional market layers, studies and dated coverage.
1. Start with the price journey
Choose 1h, 4h or 1d candles and a window that includes the move. Inspect candles for open, high, low and close. Click to lock a candle while you read its context; use Unlock to follow the pointer again.
Look for the largest advances, pullbacks or reversals. An endpoint return tells you where price finished relative to where it began; it does not describe how it got there.
2. Select the move you mean
Open A → B · What changed? to compare the visible range. Use Pick two candles to choose your own endpoints. The dotted markers and shaded area identify the selected span; Visible range resets the comparison to what is on screen.
The selection includes both endpoint candles. A and B stay fixed while you inspect the chart. Read their dates and original candle interval in the comparison panel, especially after changing the display interval.
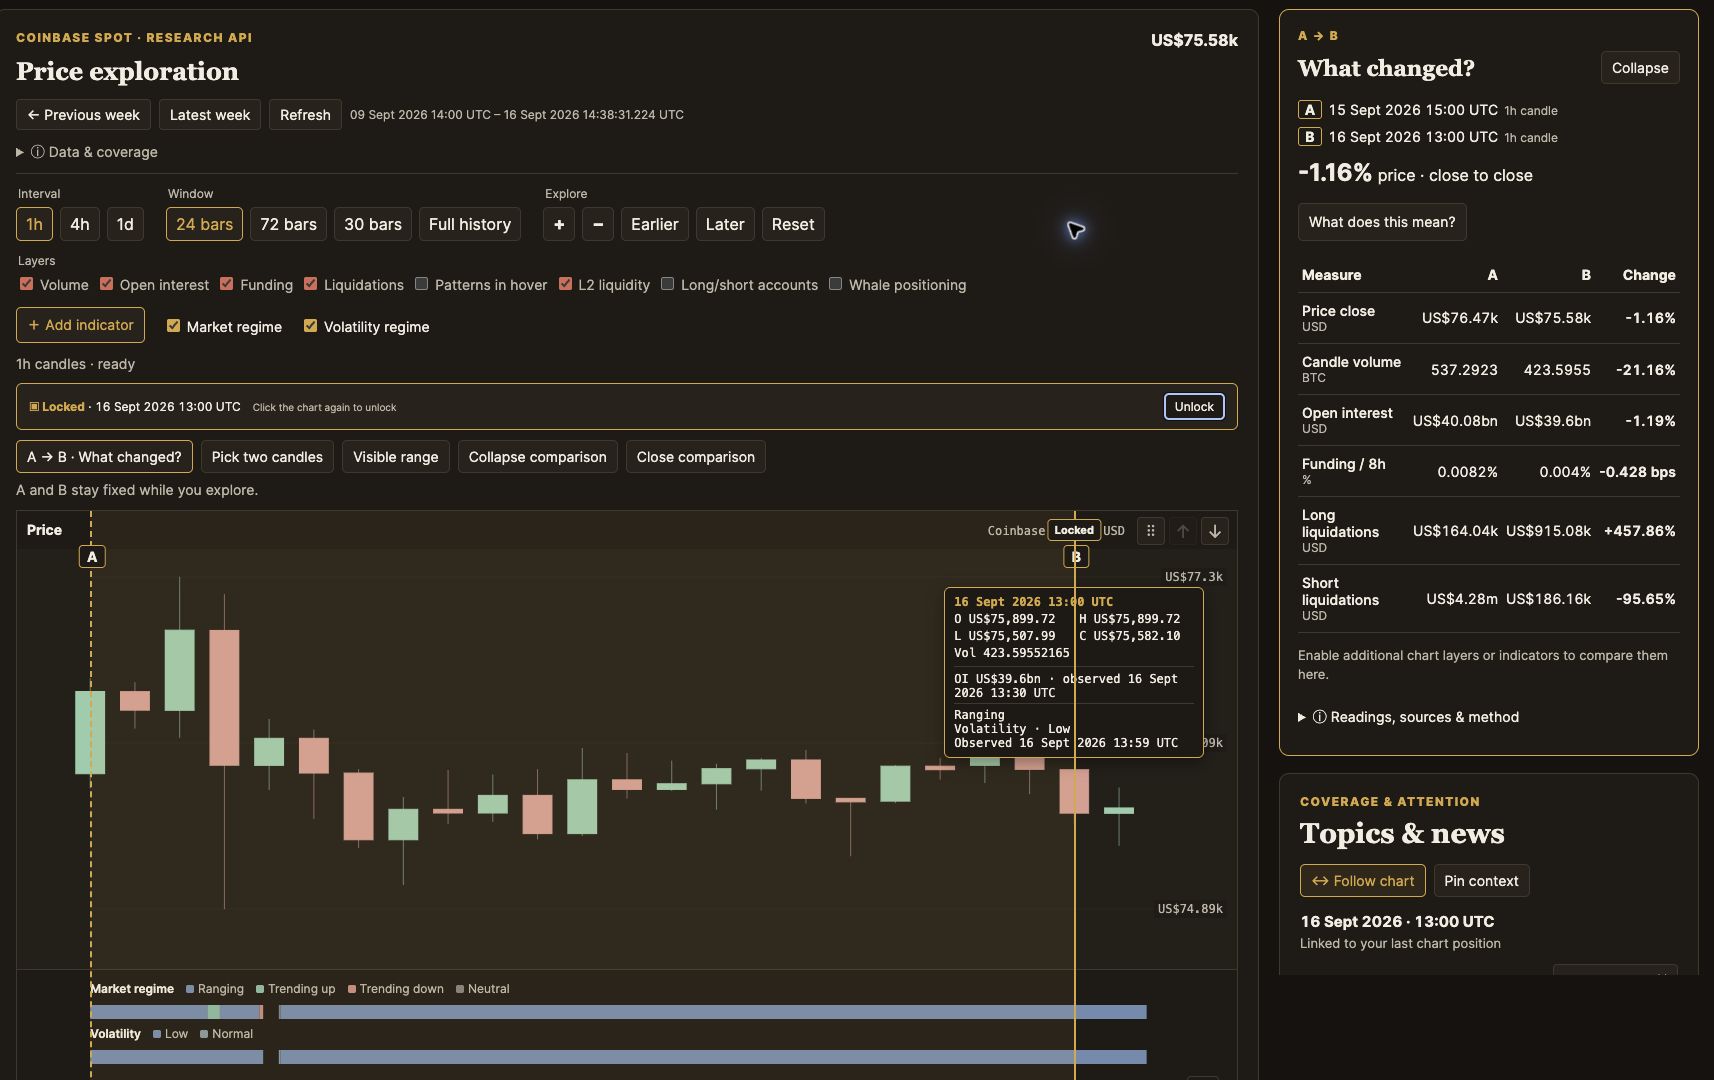
Captured 16 September 2026. The controls and numbers above are a static example.
3. Add context deliberately
| Your follow-up question | Add |
|---|---|
| Was there more or less trading activity? | Spot volume |
| How did reported derivatives exposure change? | Open interest |
| Which side was paying to hold perpetual exposure? | Funding |
| Was forced closing concentrated on longs or shorts? | Liquidations |
| Did the quoted price gap or available book depth change? | L2 liquidity: spread, depth and balance |
| Was momentum cooling, or did its balance change? | An available RSI study |
| Were movements becoming more directional or larger? | Available ADX or ATR studies, respectively |
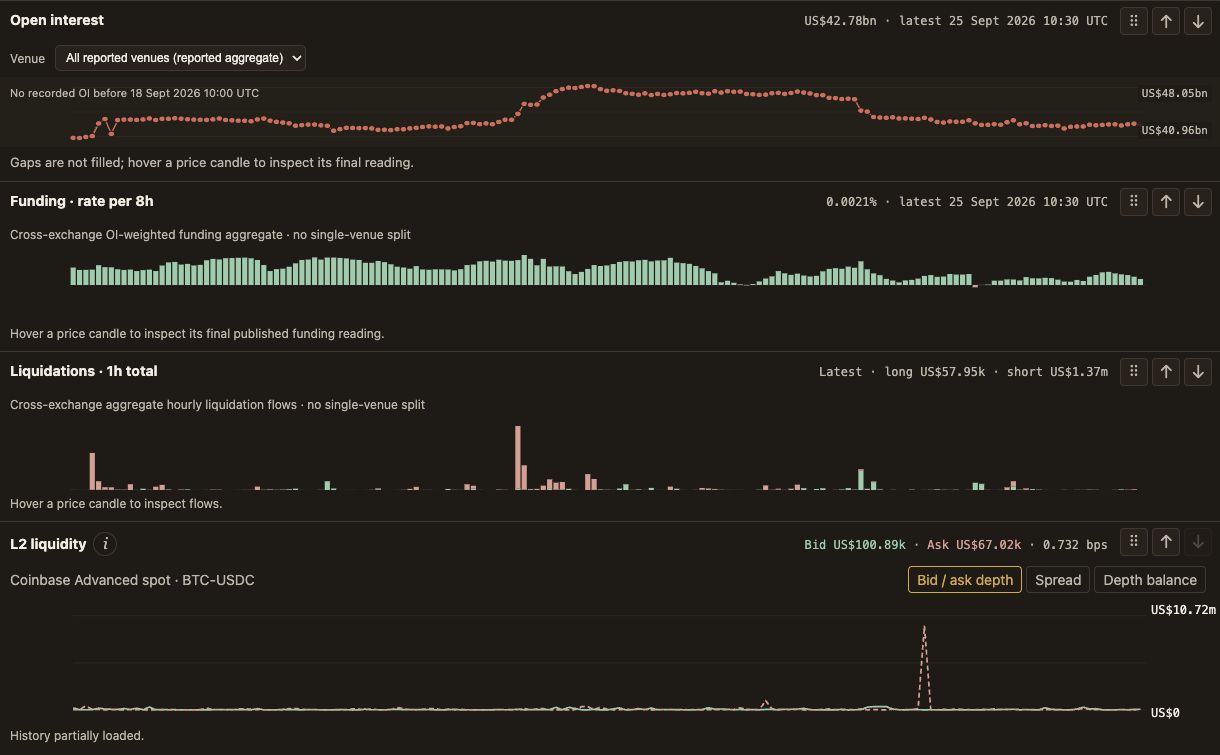
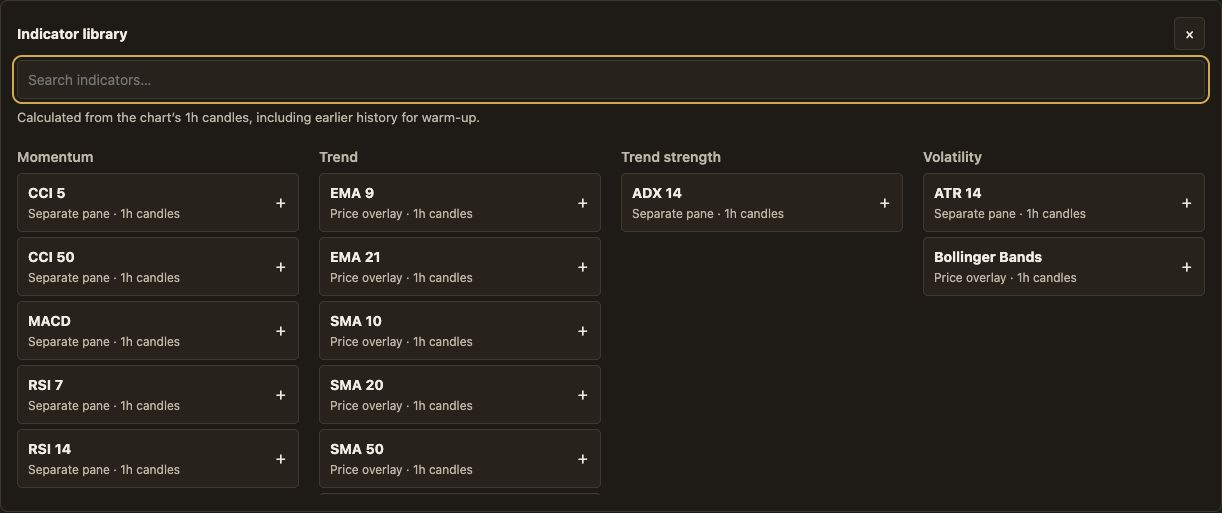
Use Add indicator to see the studies actually available for that asset and period. Studies are calculated by Research from the selected 1h, 4h or 1d candles. Their identity includes the calculation interval and configuration; changing interval selects the matching catalogue study. Warm-up, open or invalid candles remain gaps. An explicitly requested native study retains its separate source clock and is never substituted for an unavailable candle study.
The indicator library
Other numerical layers also line up with the selected candles through the shared API. Funding, open interest, account positioning and book liquidity are selected snapshot readings; their actual source times remain visible. Funding stays a rate per eight hours, even on daily candles. Volume and liquidations are interval flows: partial observations are not complete-period totals.
Market regime and volatility use their own hourly clock: changing the price-candle interval does not change those observations. Open the combined guide.
4. Ask “What does this mean?”
The button requests a deterministic full-range explanation. It looks for prominent price moves and selects supporting observations from the layers and studies you enabled. It is not generated from a historical Market Intelligence Assessment or a new LLM call.
The short answer leads with the price journey. Expand the selected metrics to inspect the evidence behind it. The ⓘ control explains the method.
Why there are two sets of numbers
The A/B table compares readings associated with the two chosen candles. The range explanation examines observations throughout the selected span. For example, endpoint candle volume is not the total volume across a multi-day move.
A newly requested explanation may use history corrected since the chart loaded. Its read time and observed first/last values are separate from the captured A/B table. Timing and sources explains this distinction.
5. Bring in coverage
Use the ticker's video timeline and Topics & news to see relevant published coverage. Follow chart follows your chart inspection time; pinning context keeps news on its own date while you explore.
Read coverage on its own clock, or continue the investigation in your assistant.