Funding widget
The question: “Which side is paying to hold perpetual exposure, and did that change?”
Show Bitcoin funding over the same period.
Funding is the periodic carrying-cost rate between perpetual-futures longs and shorts. The widget plots a signed green/red histogram on the funding rate's own basis.
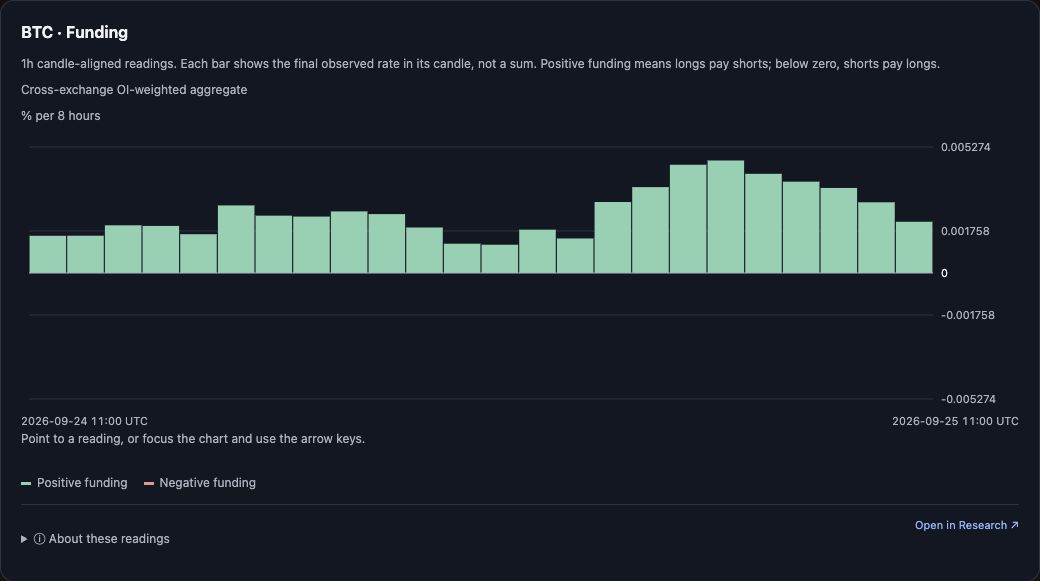
Captured 25 September 2026: BTC · Funding, 2026-09-24 11:00 → 2026-09-25 11:00 UTC, showing the signed rate history and the Cross-exchange OI-weighted aggregate scope. Select the image to view it full size.
What it shows
- Green bars — positive funding: longs pay shorts.
- Red bars — negative funding: shorts pay longs.
- The scope line names the source: Cross-exchange OI-weighted aggregate.
- The unit line states percent per 8h on the returned basis.
Controls
- No widget-specific selector: the funding basis and source are fixed by the returned series.
- Shared controls: Expand when the host supports fullscreen, Get a fresh read, Open in Research ↗.
Units, selection and limits
- Funding stays percent per eight hours even when the chart uses 4-hour or daily candles. Candle alignment picks the last observed rate in each candle; it is never a candle sum.
- Positive rates mean longs pay shorts; negative rates reverse that payment direction. Neither proves a directional view.
- Missing periods remain gaps, not zero.
A useful follow-up
Was funding positive through the whole move, or did it cross zero?
A crossing needs observations on both sides; a single negative reading does not establish when the change happened.