Cohorts widget
The question: “Was this a group-wide move, or did a few members carry it?”
Compare DeFi with artificial intelligence assets over seven days, using Bitcoin as the benchmark.
The widget renders one pinned group comparison. The view is chosen when the assistant requests the widget; the focused widget itself has no generic “Chart” selector, so ask for the view you want.
Views
| View | What it answers |
|---|---|
| Price performance | Each group's price journey over the pinned period |
| Versus benchmark | Whether a group was ahead of or behind the benchmark (above/below zero) |
| Member contributions | Which members account for the group's return, in percentage points. The focused widget shows the largest eight contributions — the Research browser's Contributions table shows sixteen |
| Metric relationships | How two chosen readings vary across individual assets |
| Pair correlation | Whether two return series moved together through time, only where qualifying matched observations exist |
Example requests:
- Price performance: “Compare DeFi with AI-related assets over seven days, using Bitcoin as the benchmark.”
- Versus benchmark: “Show that comparison relative to Bitcoin.”
- Member contributions: “Which members account for the difference?”
- Metric relationships: “Plot price return against open-interest change for the same window.”
- Pair correlation: “Show the 24-hour rolling correlation for BTC and ETH on this snapshot.”
The view comes from the show-tool presentation when the assistant requests the widget; there is no local view picker. Pair correlation plots a −1 to +1 range and draws a point only where enough matched return observations qualify — gaps are warm-up or insufficient matches, not zero correlation.
Captured views
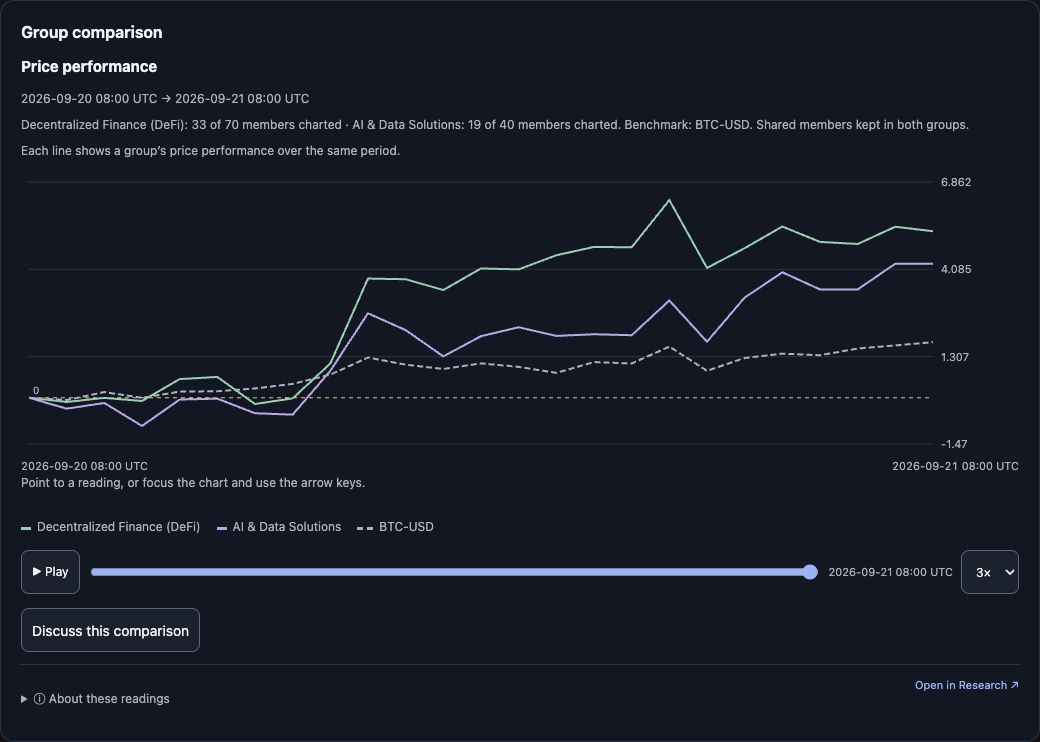
Captured 25 September 2026, rendered from the current released bundle using the verified 21 September 2026 real result (retained, not a fresh 25 September read). Price performance, 2026-09-20 08:00 → 2026-09-21 08:00 UTC; DeFi 33 of 70 and AI & Data Solutions 19 of 40 members charted.
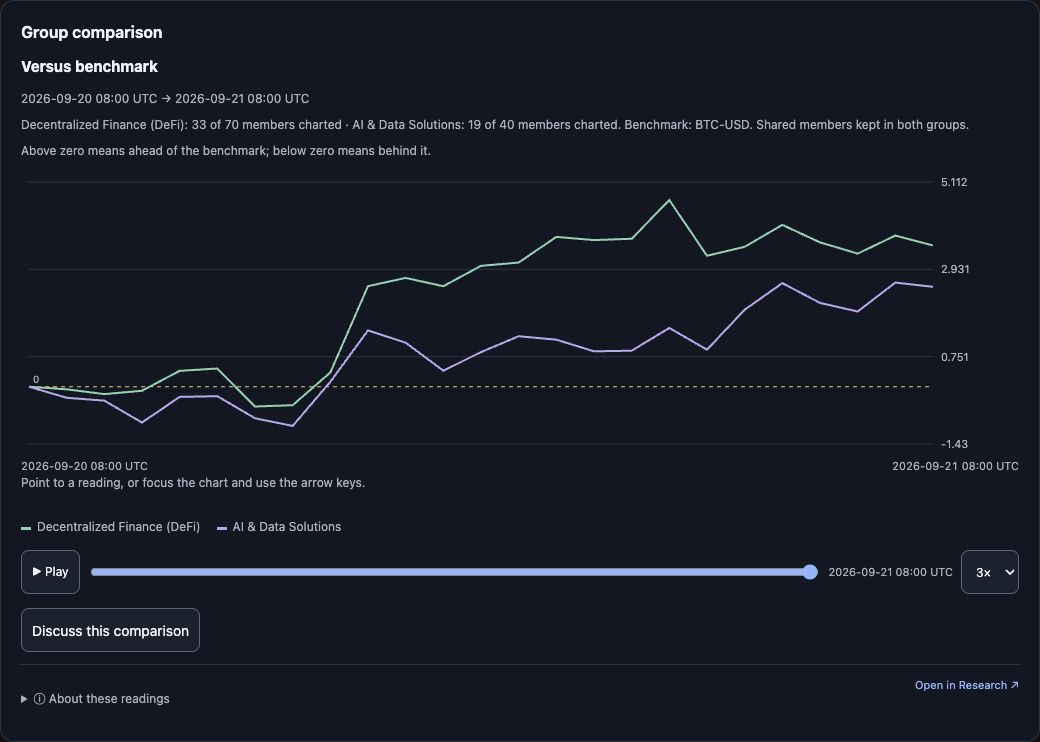
Captured 25 September 2026 from the retained 21 September 2026 result. Versus benchmark (BTC-USD), same window; above zero means ahead of the benchmark, below zero behind it.
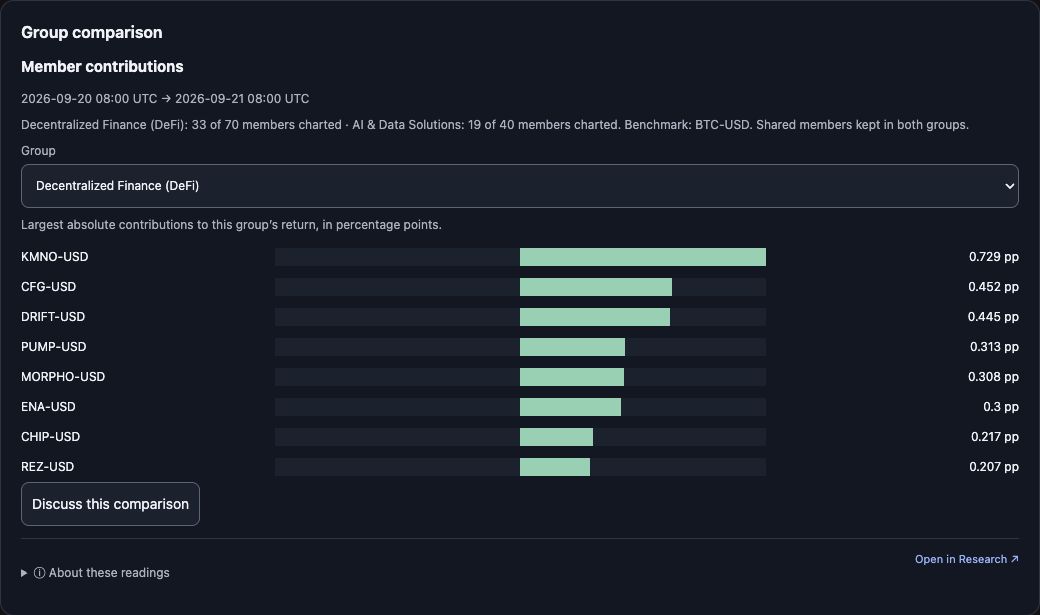
Captured 25 September 2026 from the retained 21 September 2026 result. Member contributions for Group A (DeFi): the focused widget shows the top eight members by absolute contribution, in percentage points.
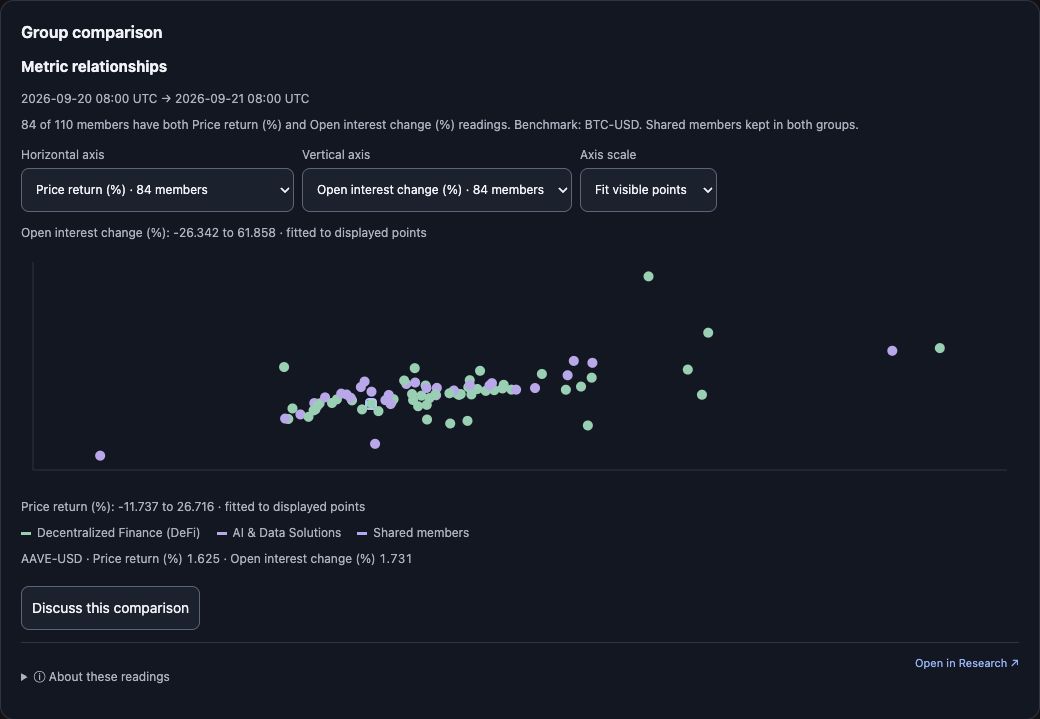
Captured 25 September 2026 from the retained 21 September 2026 result. Metric relationships: horizontal axis Price return (%), vertical axis Open interest change (%), axis scale Fit visible points; 84 of 110 members have both readings. The pointer readout shows AAVE-USD · Price return (%) 1.625 · Open interest change (%) 1.731. This is a relationships view, not a funding chart.
The retained result has no qualifying correlation pair, so no correlation capture is shown here; that view needs two assets with enough matched observations.
Controls
- Price performance and versus benchmark include a local ▶ Play replay over the pinned history; replay reveals already-loaded observations and changes no values or selection.
- Contributions: a Group selector chooses Group A or B. Bars are the largest absolute contributions in percentage points under the comparison's weighting.
- Relationships: Horizontal axis, Vertical axis and Axis scale (Fit visible points / Full-period scale). Hovering a point — or focusing it with the keyboard — shows a readout with the ticker and both axis values. Assets missing either reading remain gaps; options with no matching assets are disabled.
- Correlation: reports the pair and window it qualified; an insufficient window returns an explicit explanation rather than a false zero.
- Discuss this comparison sends a follow-up question built from the live controls; the message names the current view, axes, dates and evidence. It does not rebuild the chart.
- Check progress appears while a prepared history is still being built.
- Shared controls: Expand when the host supports fullscreen, Get a fresh read, Open in Research ↗.
Units, selection and limits
- Performance and relative views use % and percentage points; contributions use percentage points; relationships use each chosen metric's own units.
- The comparison uses pinned history and current category membership — it is not a backtest of historical membership.
- Group A and Group B are your chosen groups, not ratings. Check overlap before interpreting similar lines.
A useful follow-up
Switch to contributions and name the largest positive and negative members.