Market regime and volatility widget
The question: “Is this market unusually quiet or active, and how unusual is that for this asset?”
Show the market regime and volatility context for Bitcoin over the last seven days.
The widget combines two readings that share one hourly clock: a volatility chart for observed hourly variation and a regime strip naming the model state for the same hour. Neither is a forecast.
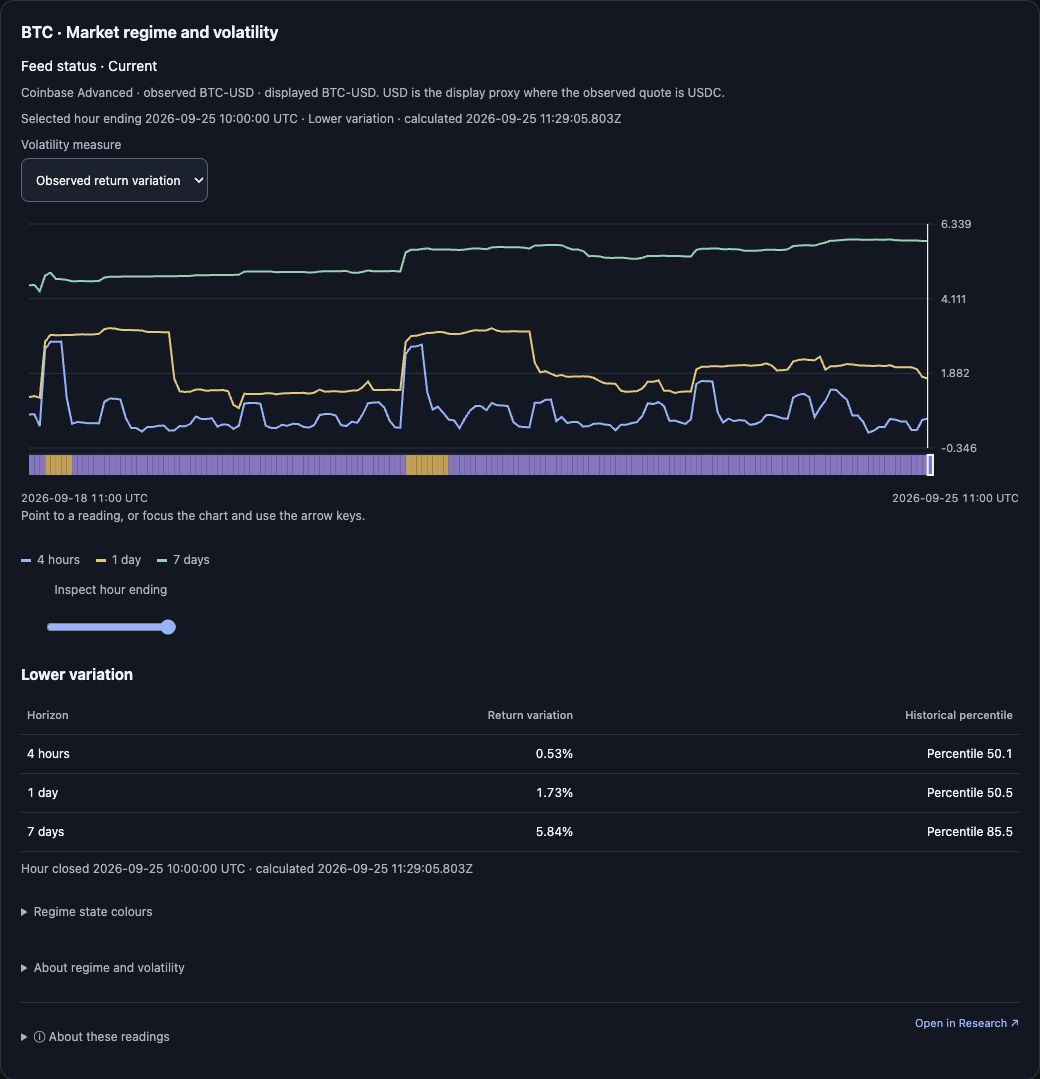
Captured 25 September 2026: BTC · Market regime and volatility with 2026-09-25 10:00:00 UTC selected (Lower variation), the observed-return-variation chart over 2026-09-18 11:00 → 2026-09-25 11:00 UTC, and the 4-hour/1-day/7-day table (0.53% / 1.73% / 5.84%; percentiles 50.1 / 50.5 / 85.5). Select the image to view it full size.
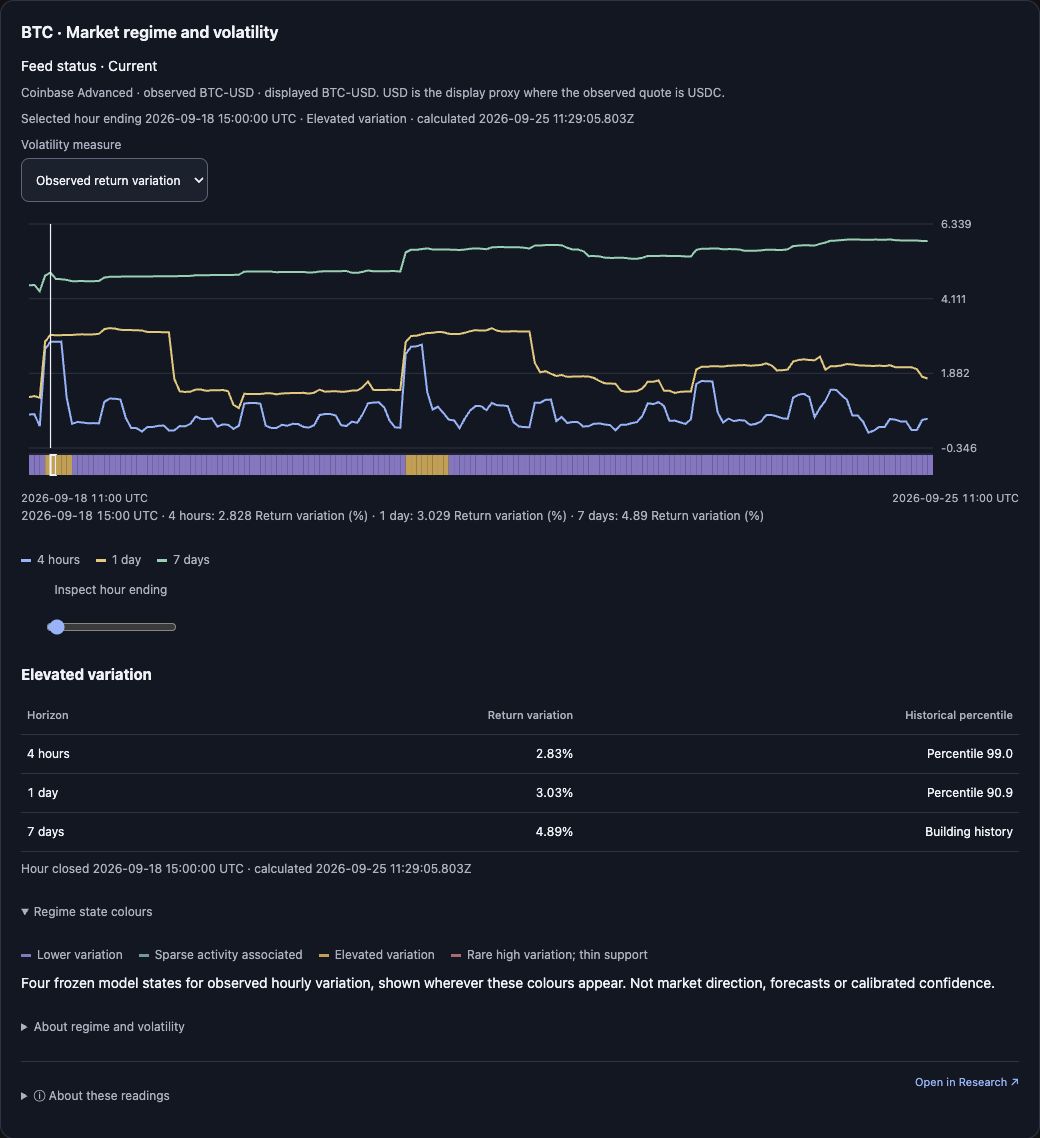
Captured 25 September 2026: 2026-09-18 15:00:00 UTC selected (Elevated variation), 2.83% / 3.03% / 4.89% with percentiles 99.0 / 90.9 and the 7-day rank still Building history; the Regime state colours legend is open. Select the image to view it full size.
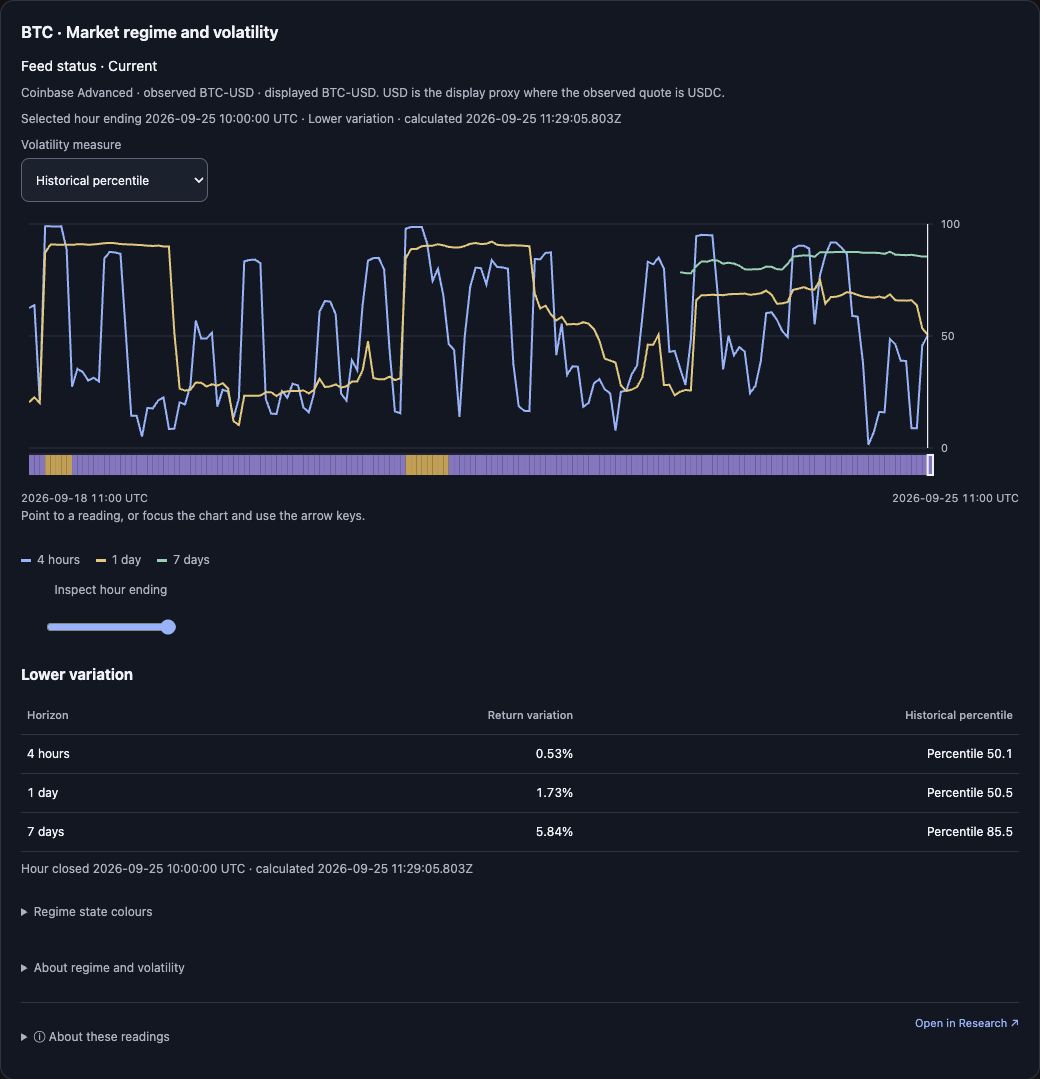
Captured 25 September 2026: Volatility measure = Historical percentile for the 2026-09-25 10:00:00 UTC selection, on the 0–100 scale. Select the image to view it full size.
Controls
- Volatility measure — Observed return variation (percent) or Historical percentile (0–100).
- Inspect hour ending — a shared reader. Moving it points the chart, the regime strip and the readout at the same already-loaded hour; it does not fetch new data.
- Regime state colours — the legend for the four frozen states: Lower variation (purple), Sparse activity associated (teal), Elevated variation (amber), Rare high variation; thin support (pink).
- Shared controls: Expand when the host supports fullscreen, Get a fresh read, Open in Research ↗.
Units, selection and limits
- The context clock stays hourly when a price chart uses 4-hour or daily candles.
- Three horizons are available: 4 hours, 1 day and 7 days. Return variation is the square root of summed squared hourly log returns, expressed as a percentage and not annualised.
- Percentiles compare this market with up to 90 days of available prior observations — a cap on the available baseline, not a promise of 90 complete days. A magnitude can exist while its percentile is still building history.
- An unchanged state colour while volatility moves is valid: the state is an hourly classification; the magnitudes are separate measurements.
- Missing observations remain gaps. The widget can state “No finite readings for this measure; regime observations remain.” when only the strip has data.
A useful follow-up
Was the state the same earlier in the window? Select that hour and compare both readings.