Open interest widget
The question: “How did reported derivatives exposure change, and where?”
How did open interest change during that move?
Open interest (OI) is the value of outstanding derivatives positions reported by the returning sources. The widget shows USD values and keeps reported venues distinct.
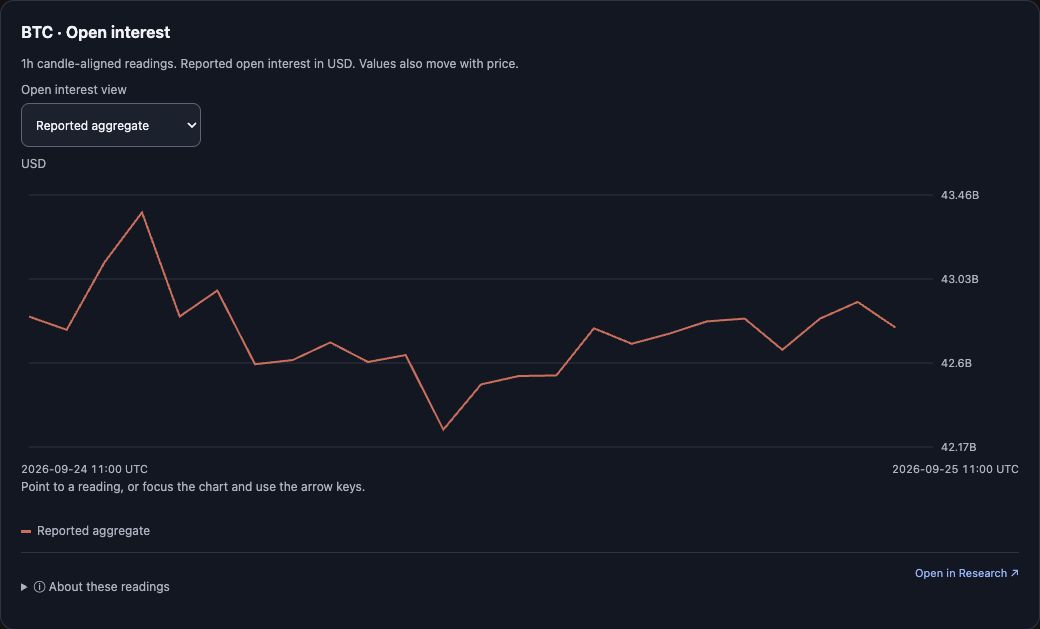
Captured 25 September 2026: BTC · Open interest in Reported aggregate view, 1h candle-aligned USD, 2026-09-24 11:00 → 2026-09-25 11:00 UTC. Select the image to view it full size.
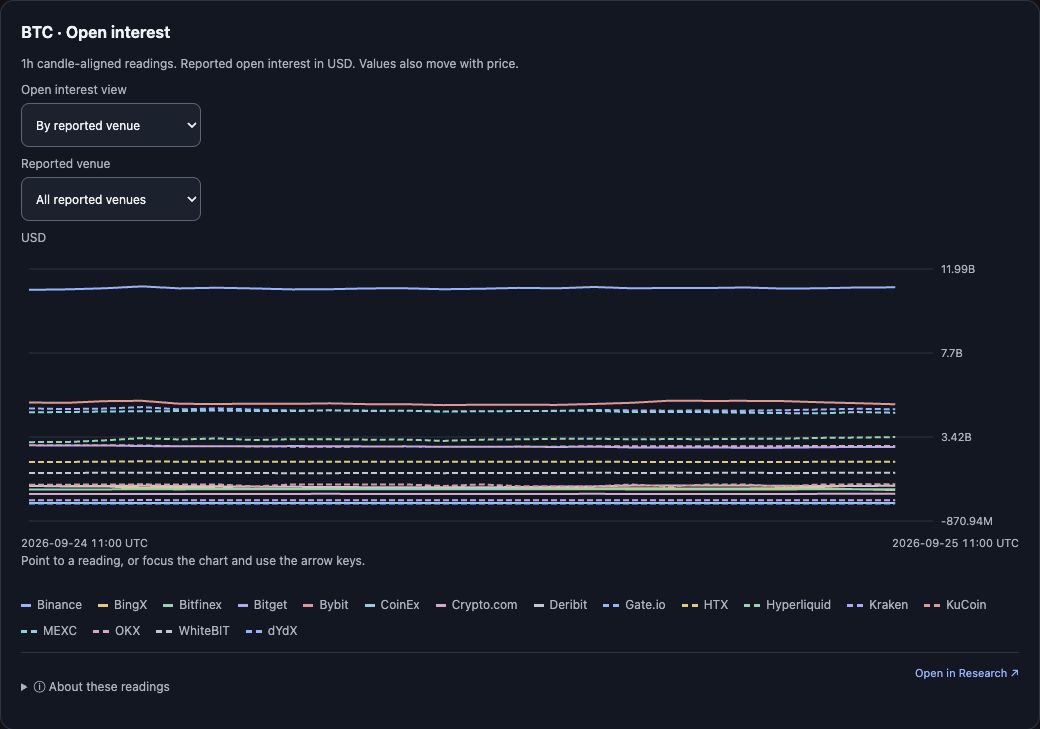
Captured 25 September 2026: the same window in By reported venue view with All reported venues and each returned venue as its own line. Select the image to view it full size.
Controls
- Open interest view — Reported aggregate (one line) or By reported venue (one line per returned venue).
- Reported venue — filters the per-venue view to one of the exact returned venues; All reported venues restores the set. A venue absent from the loaded result keeps an explicit “not reported in this selection” option instead of silently switching to another venue.
- Legend lines follow the selected view.
- Shared controls: Expand when the host supports fullscreen, Get a fresh read, Open in Research ↗.
Units, selection and limits
- Values are USD in the API's matching collection cycle for each candle. The widget does not sum venues and does not invent an aggregate split.
- Because the value is denominated in USD, it also moves with the underlying price. A fall in USD open interest is not automatically evidence that traders closed positions.
- Snapshot readings are not candle totals; each returned value keeps its own observation cycle.
A useful follow-up
Switch to per-venue and tell me which venue moved most during the same period.