Liquidations widget
The question: “Was forced closing concentrated on longs or shorts?”
Show liquidations alongside that sell-off.
The widget plots reported forced closures as long and short flows, separated by direction.
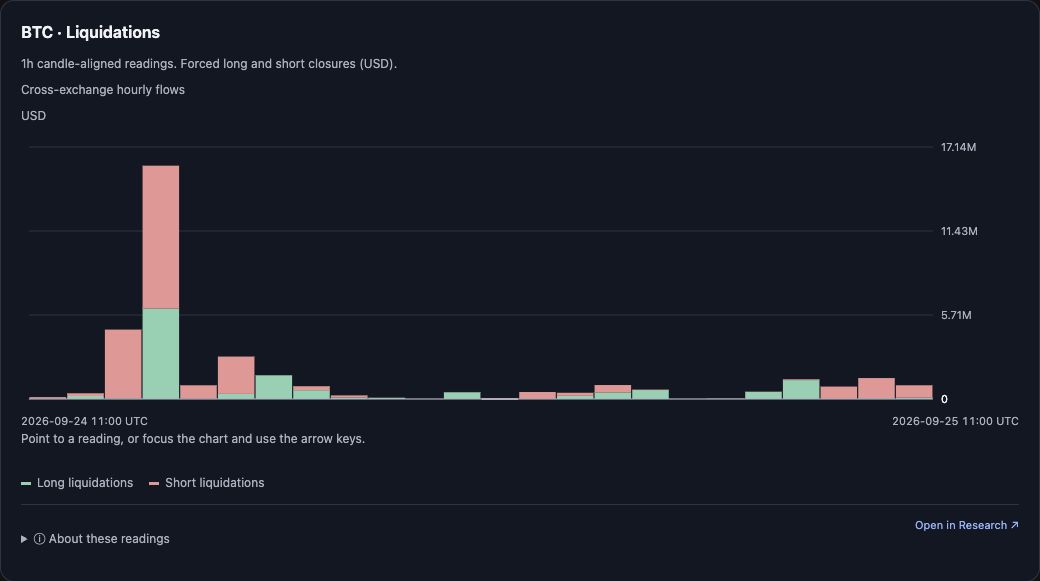
Captured 25 September 2026: BTC · Liquidations with a 1-hour selection, 2026-09-24 11:00 → 2026-09-25 11:00 UTC. Select the image to view it full size.
What it shows
- Long liquidations — forced closing of long positions.
- Short liquidations — forced closing of short positions.
- Stacked bars use the up/down colours; the scope line reads Cross-exchange hourly flows.
- When some returned periods are partial, the widget labels them Includes observed subtotals.
Controls
- No widget-specific selector: direction is carried by the two series and their legend.
- Shared controls: Expand when the host supports fullscreen, Get a fresh read, Open in Research ↗.
Units, selection and limits
- By default the chart is candle-aligned: Research sums the underlying one-hour flow periods inside each selected 1h, 4h or 1d candle bucket. A complete 4-hour or daily total is valid when the underlying hourly coverage supports it.
- The captured example uses a 1-hour selection, so each bar is one summed hourly bucket.
- Values are USD, positioned at the selected candle's opening; the underlying flow periods keep their real source times.
- Missing hours remain gaps, not zero. When some returned periods are partial, the widget labels the chart Includes observed subtotals, and those subtotals are not eligible as complete-period comparisons.
- Only an explicitly requested native read keeps the one-hour source rows.
A useful follow-up
Which side dominated the largest hour, and what did funding do then?