News widget
The question: “What was reported about this asset around this day?”
Show the news context for Bitcoin on 14 September 2026.
The widget shows a source-linked dated timeline of articles in the window the API supplies. It is not a chart, and it does not draw daily mention counts.
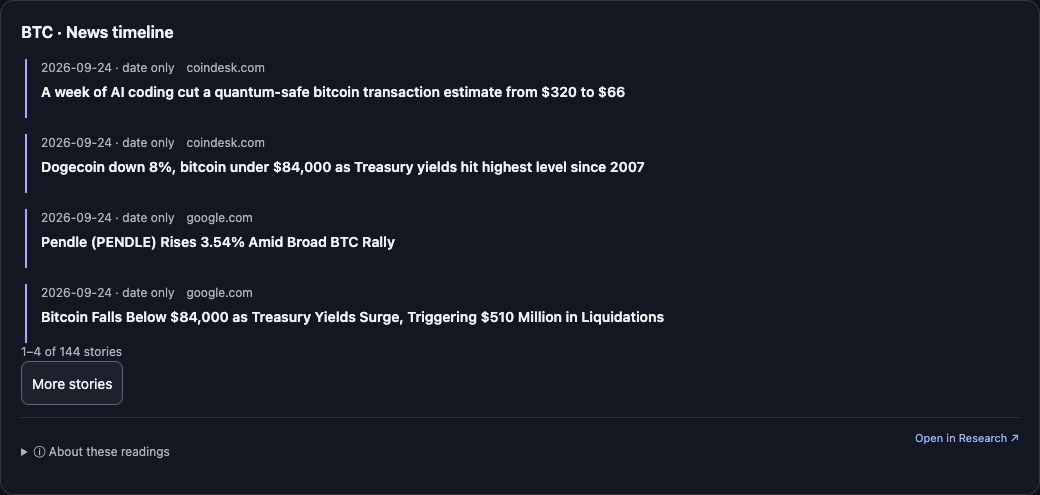
Captured 25 September 2026: four rows of a returned 144-story window, each with its publication date (day-only here), source domain and article link, plus More stories. Select the image to view it full size.
What it shows
Each row has:
- the publication time, with “· date only” when the source provides day precision,
- the source domain, when returned,
- a link to the published article.
Controls
- Previous stories / More stories — pages the returned timeline four entries at a time (local paging).
- Row links open the published source.
- Shared controls: Expand when the host supports fullscreen, Get a fresh read, Open in Research ↗.
Units, selection and limits
- The API chooses the actual lookback window around your anchor day; the widget states the window it used.
- The result can also carry daily topic-attention counts for the assistant's context. Those counts are not drawn as a chart in this widget, and they are not a count of the linked articles available to open.
- The Research context bubble is a different surface: it appears in the Research browser around a market event. The focused News timeline has no bubble visual.
- Publication time and the market period discussed are separate.
A useful follow-up
Which of those stories is linked to the ETF topic, and what did price do that day?