Study widget
The question: “What does this indicator say on the candles I selected?”
Show RSI 14 for that range and explain what it measures.
The widget plots one indicator calculated by Research on the selected supported candle interval (1 hour, 4 hours or 1 day), using earlier history for warm-up. It is the chat-side view of the Research indicator library; there is no generic picker inside the widget — name the study in your request.
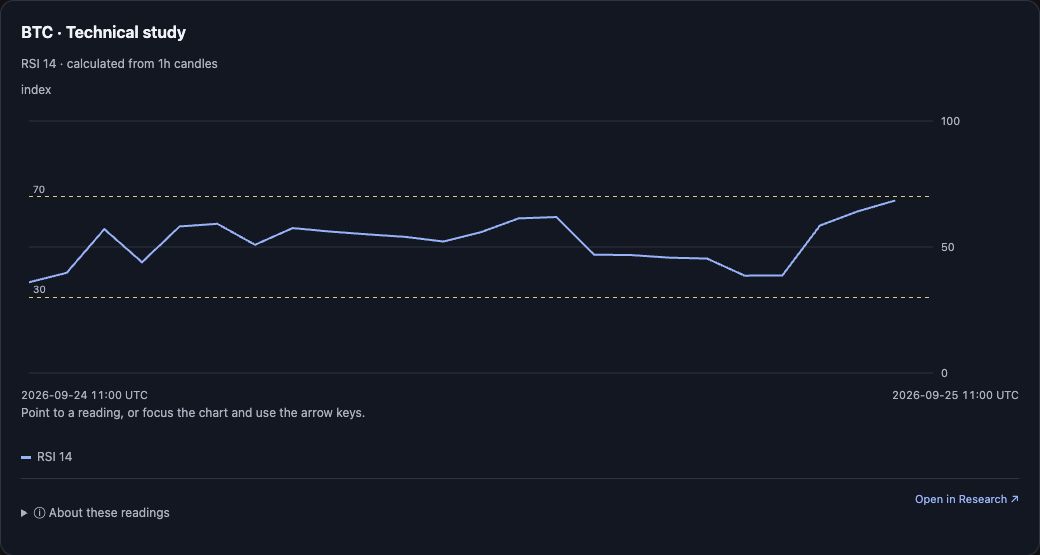
Captured 25 September 2026: BTC · Technical study, RSI 14 · calculated from 1h candles, index scale with the 30/70 reference levels, 2026-09-24 11:00 → 2026-09-25 11:00 UTC. Select the image to view it full size.
What it shows
- A chart with the study's own axis and reference levels: RSI 30/70, ADX 25, CCI −100/0/100, MACD 0 where those apply.
- A heading that identifies the study and its calculation interval, for example “RSI 14 · calculated from 1h candles”.
- Warm-up, open and invalid candles as gaps rather than values.
Controls
- Shared controls only: Expand when the host supports fullscreen, Get a fresh read, Open in Research ↗. The request itself selects the study, interval and period.
- An explicitly requested native study is the exception: it keeps its stored source clock and is never substituted for an unavailable candle study.
Units, selection and limits
- Candle-calculated studies use the exact catalogue identity for that interval; changing interval selects the matching catalogue study and is a new read.
- Periods count observed candles, not guaranteed elapsed time. Missing whole candles reset the calculation.
- Indicator values are descriptive, not signals or forecasts. RSI can remain high or low through a strong move.
A useful follow-up
Compare RSI 14 with ATR on the same candles and explain what each adds.