Find your way around Research Desk
Start with a question: what happened to this asset, how did a group behave, or what is in today’s briefing? These short visual walkthroughs show you where to go and what to click.
Actual Research screens captured on 16 September 2026. These are static examples, not live quotes. Select any screenshot to view it full size.
Investigate a price move
Open an asset from Markets or Tickers, then select a move with A → B. Add the readings that answer your next question: trading activity, funding, positioning or liquidity.
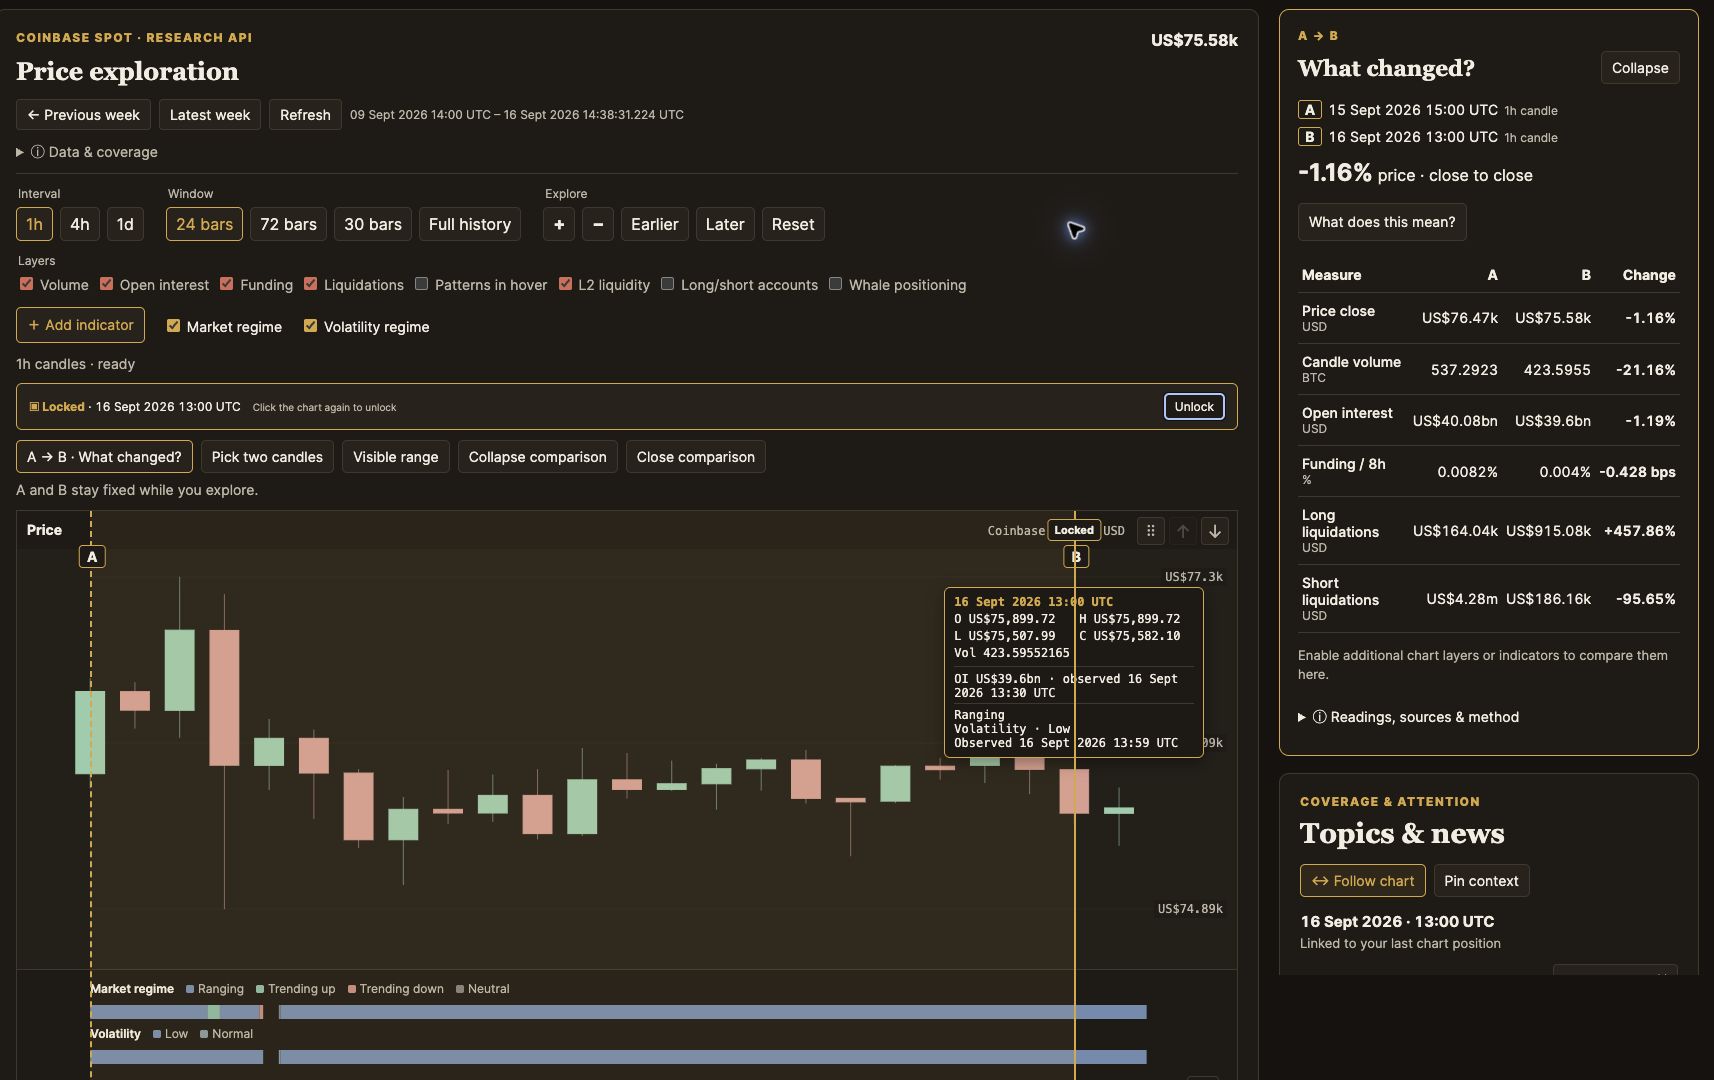
Follow the price-move walkthrough →
Compare crypto groups
Choose Group A, Group B, a benchmark and a period in Cohorts. Start with their price journeys, then explore the members or relationships behind the lines. A and B are your chosen groups—not ratings.
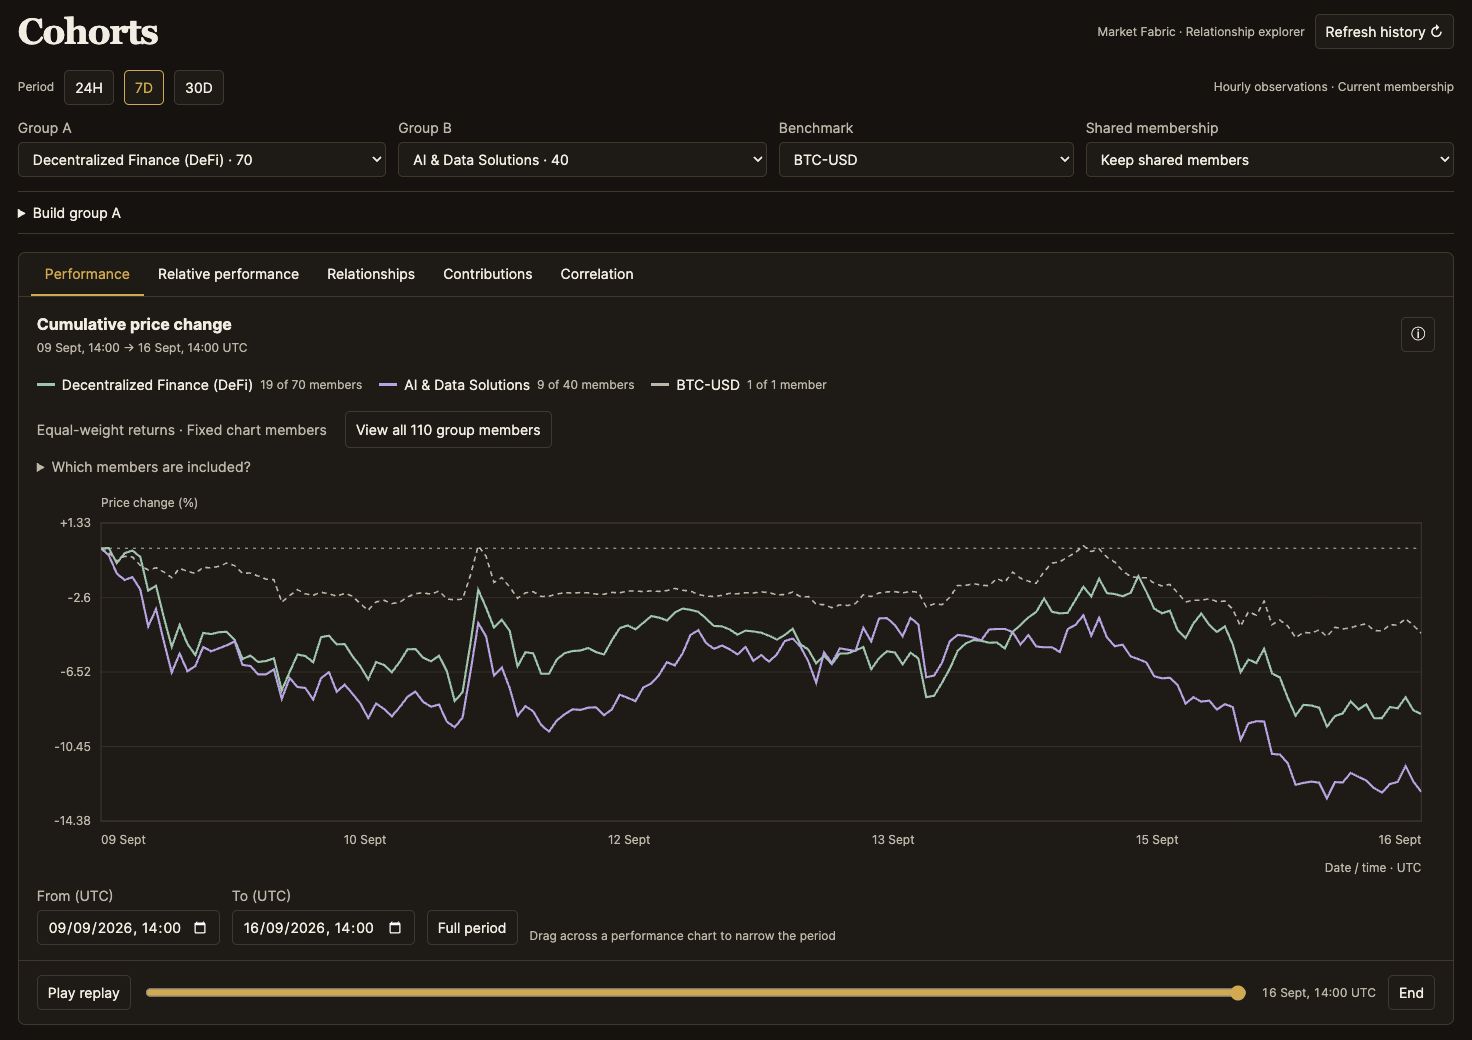
Follow the cohort walkthrough →
Read the briefing, inspect the evidence
Today brings the latest published Market Update into a chapter-by-chapter reading experience. Move between the written briefing, the original video and its recorded charts.
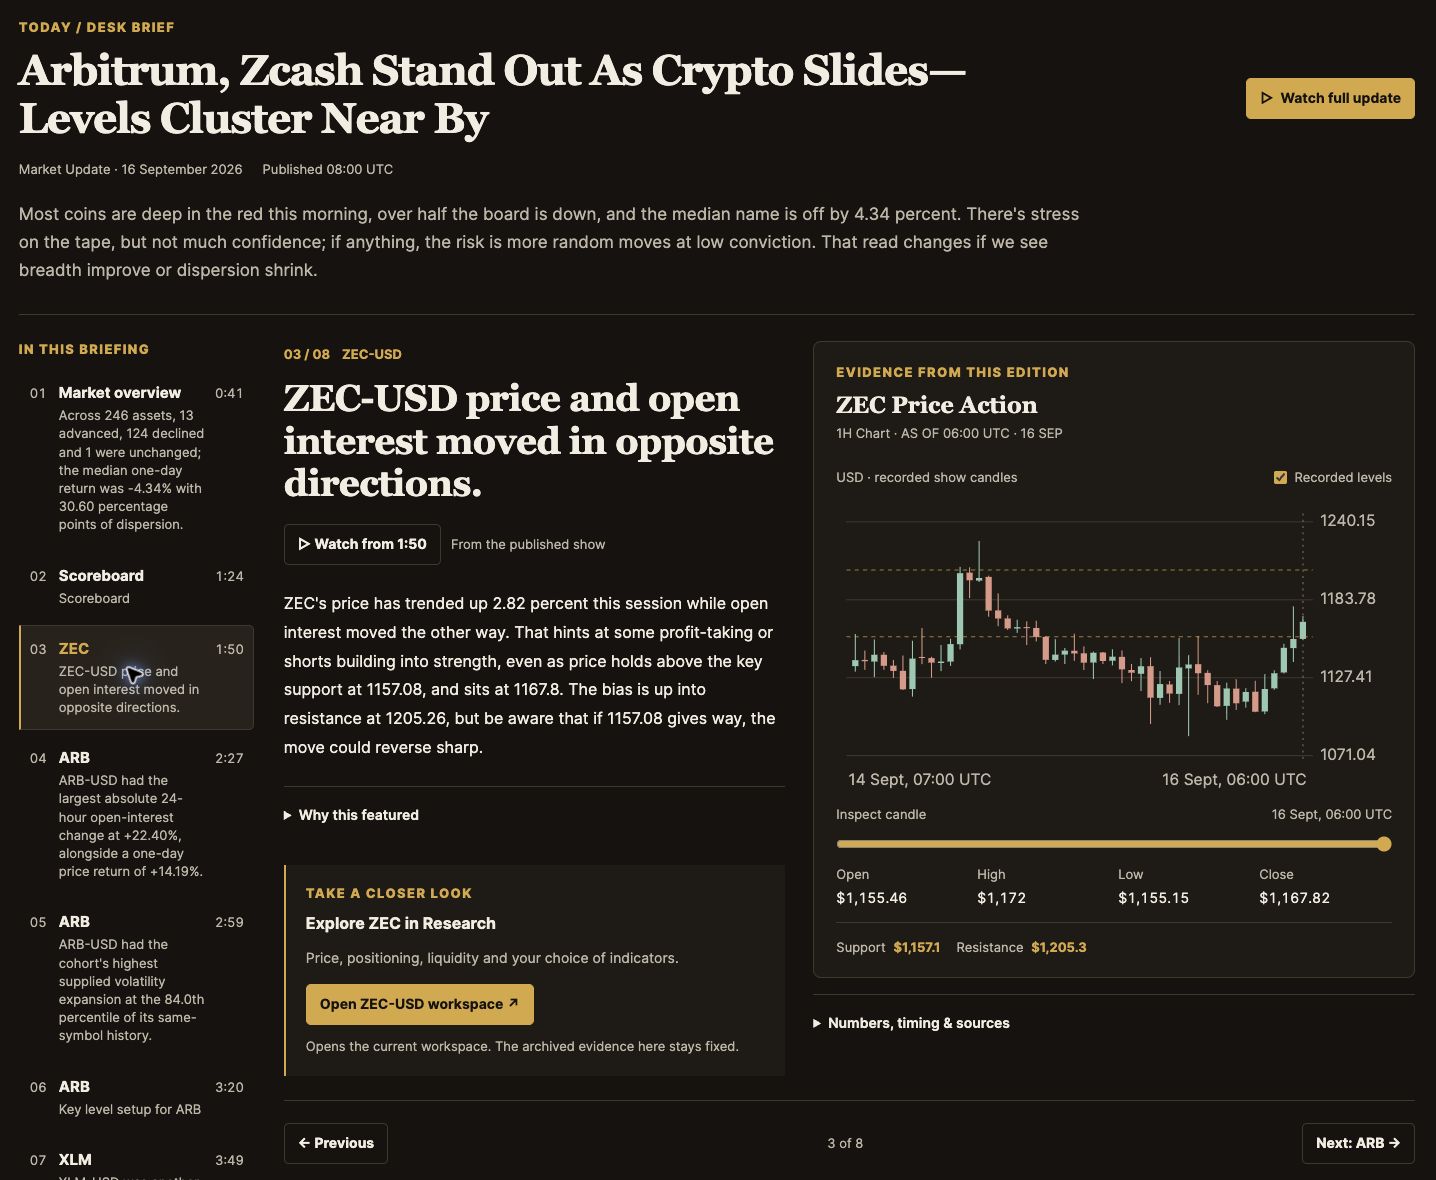
Explore the Desk Brief and timelines →
Find an asset or a theme
- Markets: browse and sort the tracked market’s readings.
- Tickers: search an asset’s name or symbol and open its chart.
- Taxonomy: inspect how assets are classified, then take a category into Cohorts.
See the directory and market board →
Browser research and chat research
Research gives you a larger workspace with direct chart and group controls. The MCP widgets give your assistant focused views and source readings in a conversation. Both use the same Research API.
The dashboard's range explanation is calculated by fixed rules from the selected history. Your assistant can use that evidence for a broader discussion, with its own interpretation. The recorded Market Update is a third thing: published editorial reporting, preserved at its publication time.
An Open in Research link from chat takes you to the relevant ticker or section. It does not transfer every local widget setting or conversation selection. Saved personal workspaces and portfolios are not part of this first version.
Is this market unusually quiet or active?
The combined market regime and volatility guide explains the hourly context panel: its 4-hour, 1-day and 7-day variation horizons, the historical percentile window and the frozen state colours. You can open it beside a ticker workspace or as a focused widget in chat.
New to the terminology? · Sign in and account help · Manage your subscription